Q2 2026 Market Commentary
The second quarter of 2026 picked up where the first quarter left off, with headlines once again dominated by geopolitics and artificial intelligence.
On the geopolitical front, the war in Iran appears to be winding down. The U.S. and Iran agreed to a ceasefire and signed a memorandum of understanding that has reopened the Strait of Hormuz to tanker traffic.1 The ceasefire remains fragile, and a number of weekend skirmishes have tested it, though each was resolved before markets opened the following week. Crude oil has settled back to pre-war levels around $70 per barrel2. That is a remarkable outcome considering global strategic petroleum reserves have been drawn down their lowest levels since December 1990 and US total crude including the Strategic Petroleum Reserve (SPR) are already below the 1984 low3.
On the artificial intelligence front, memory producer Micron posted blowout earnings during the quarter, with revenue more than quadrupling from a year ago4. The results lifted the stock’s year-to-date return to 235%, an unprecedented run following a 240% gain in 20255, and Micron now ranks as the 11th largest company in the U.S. by market capitalization6. Memory has historically been a deeply cyclical business. The demand coming from frontier AI models and datacentres, however, suggests this cycle may be transitioning into something structural.
The market today can be thought of as two separate trades, AI and not-AI. The AI trade has evolved well beyond the traditional technology plays, which historically included semiconductors, memory, GPUs, CPUs and the hyperscalers (Google, Microsoft, Meta). It has since bled into construction (datacentre buildouts), turbine manufacturing (powering those datacentres), natural gas producers (fuelling the turbines), mining (copper demand for internal wiring, busbars and broader grid upgrades) and nuclear energy (long duration power supply), to mention a few. For all the euphoria around AI as a transformational technology, and the elevated equity valuations that come with it, there is equally deep pessimism toward the industries AI is projected to disrupt, including software, consulting, engineering and customer service.
The not-AI trade, or the atoms versus electrons trade, encompasses the physical industries that cannot be disrupted by AI. No amount of computing power replaces a pipeline or a railway. These businesses, along with the broader set of industrial companies that operate in the physical world, have largely been left out of the AI rally, and in many cases now trade at valuations we find attractive relative to the durability of their cash flows.
What does this mean for managing a portfolio in this environment? One thing is for certain, the elevated volatility seen through the first half of 2026 is expected to continue. A secondary effect of volatility, however, is pricing divergences from fundamentals. For an active manager with a 3 to 5 year investment horizon, we believe we are well positioned to take advantage of those pricing mismatches, creating long-term value for our clients by continuing to buy high-quality companies at attractive prices.
Source: Factset
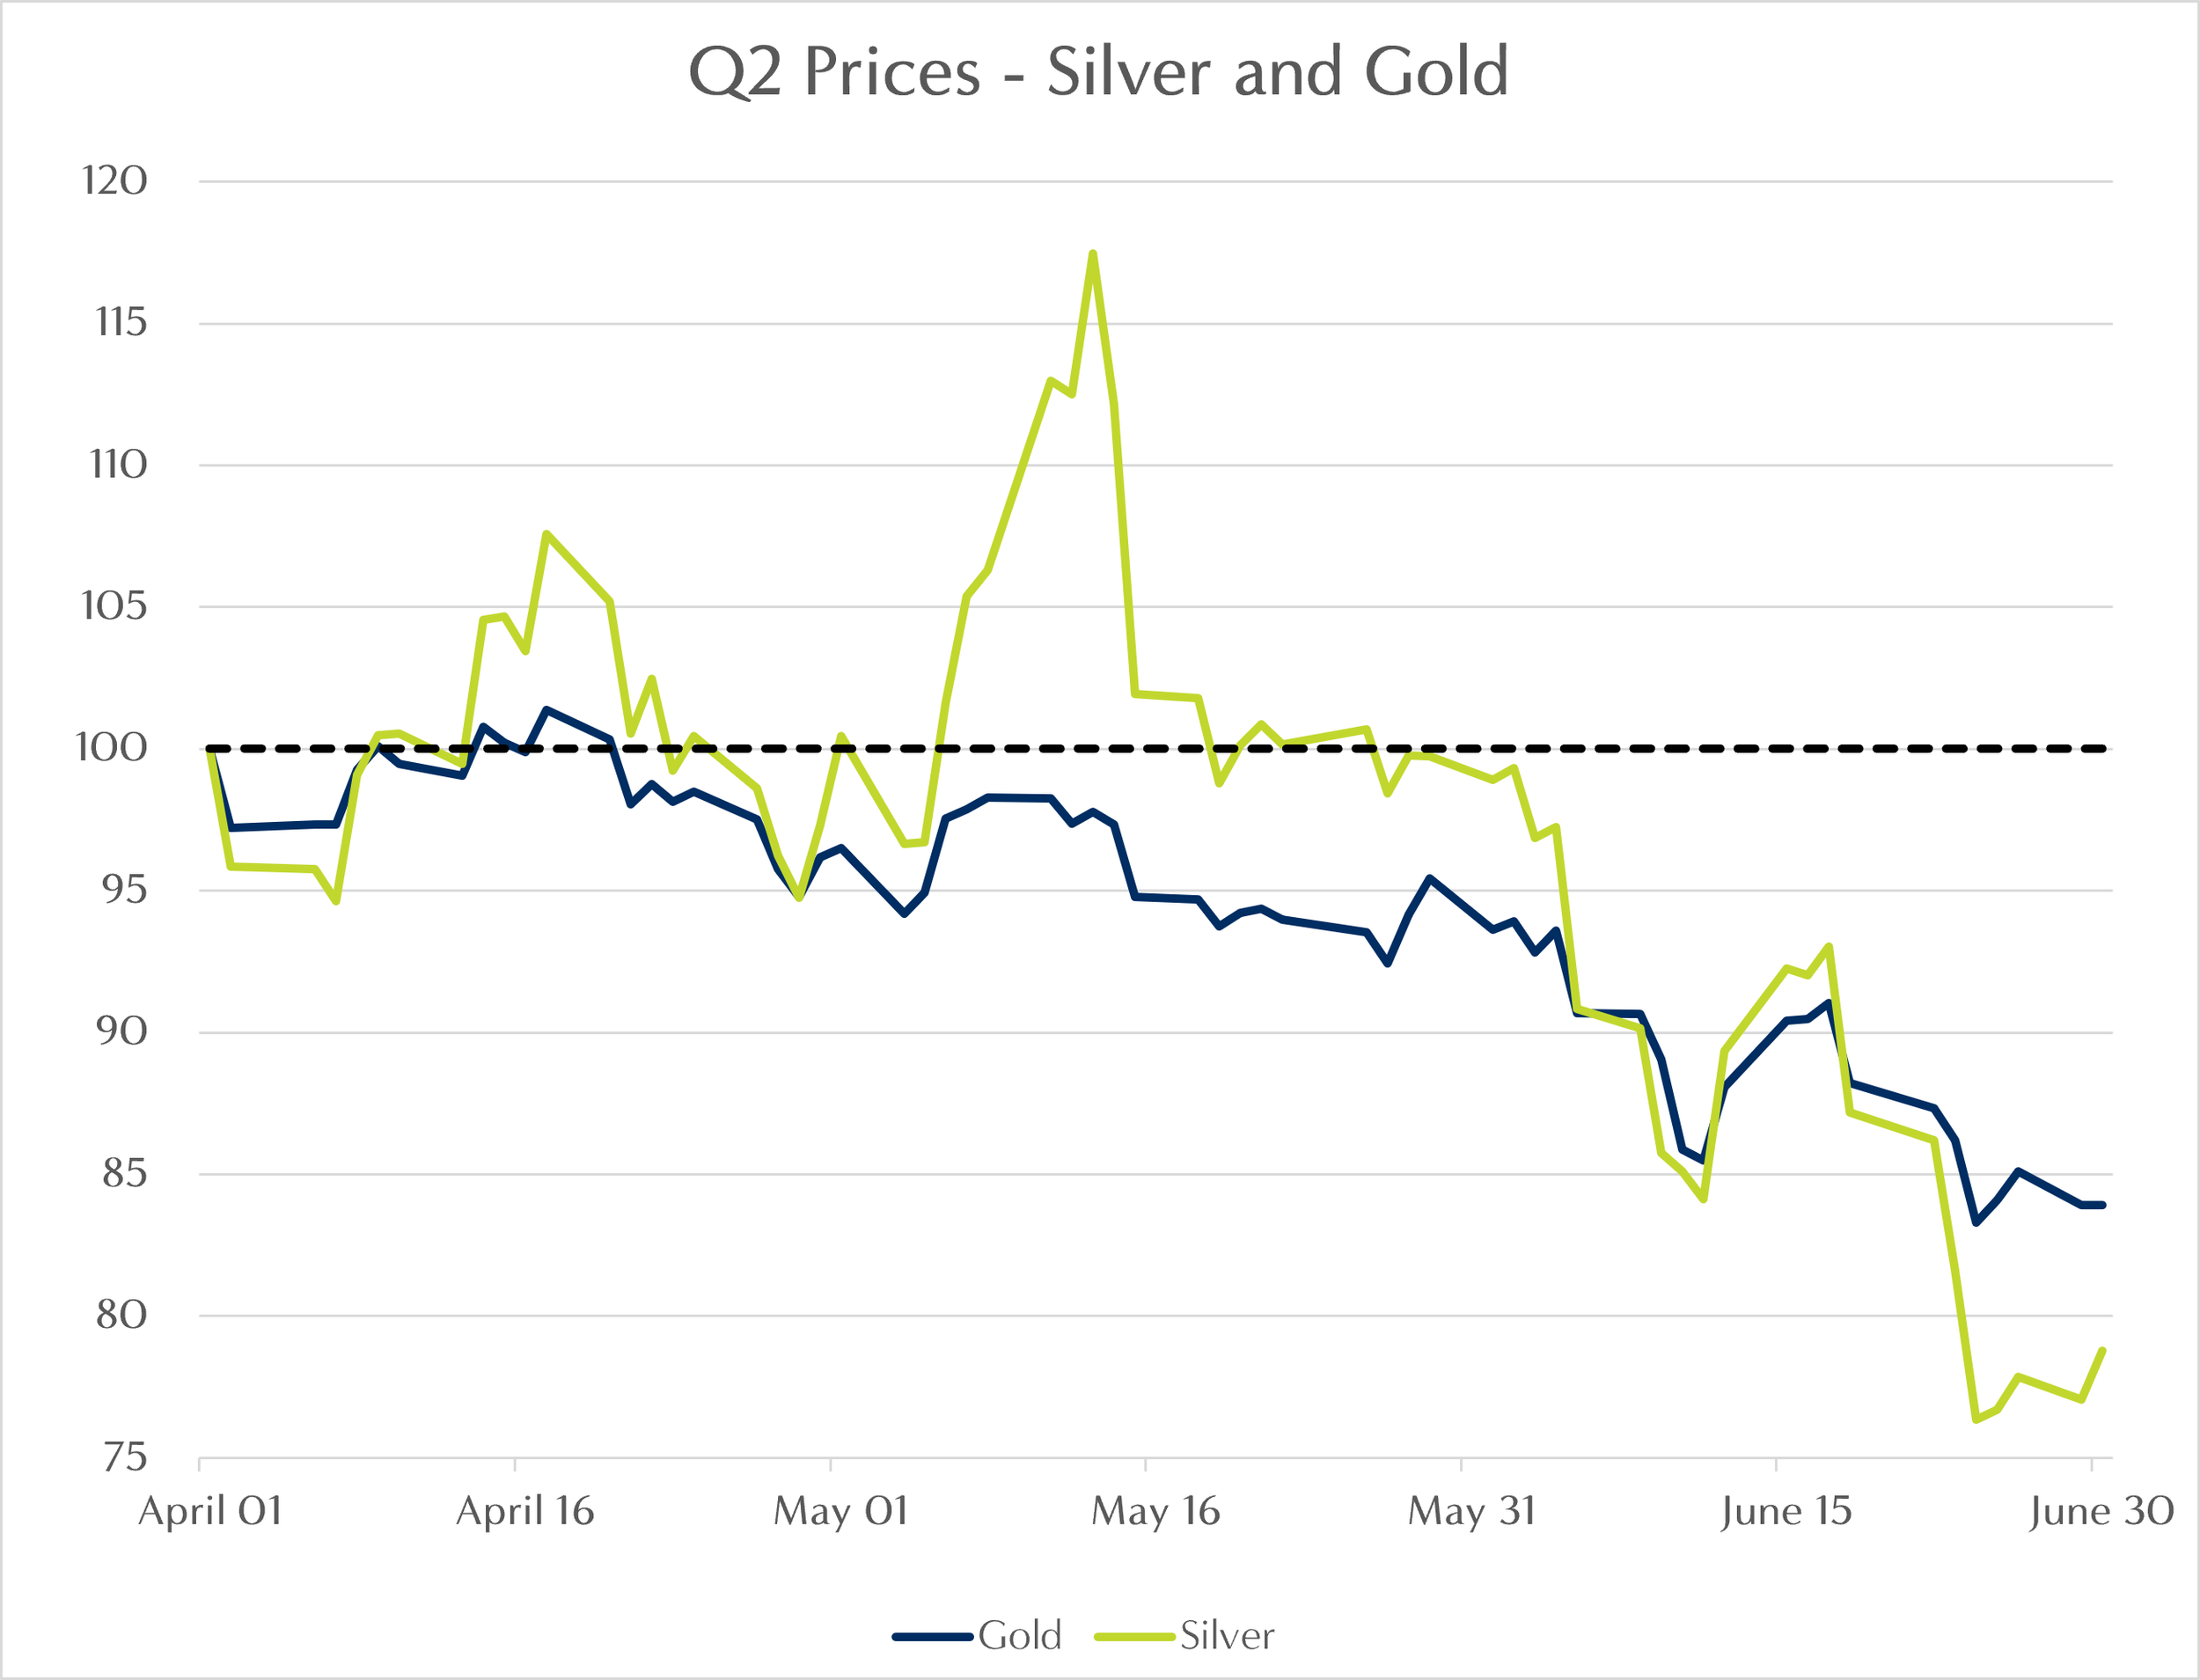
After more than a decade of stagnation, gold and silver rallied to all-time highs on the back of accelerating inflation, geopolitical crises and monetary debasement, peaking in the first quarter.7 Both metals have traded down since, as speculators exited and capital was redeployed into the AI trade. Notably, the selloff persisted even as the war in Iran sent oil north of $100 per barrel8 and reignited inflation fears, precisely the environment in which gold is supposed to shine.
Gold has traditionally been treated as a safe haven asset, a hedge in a portfolio against inflation and broader global turmoil. Its behaviour this year reinforces BCV’s long-held view of gold and silver as unproductive assets. Gold’s worth does not come from the cash flows it generates, like equities, but rather from the value the next buyer places on it. On a long-term basis, gold has underperformed equities to a significant degree.9 And in fast, liquidity-driven selloffs, the moments a hedge is meant for, gold has tended to fall alongside equities. When leveraged investors are forced to raise cash they sell what is liquid and what has gone up, and this year gold was both. Higher rate expectations did the rest, since gold pays its holder nothing while cash is now expected to return more. The Fund holds a modest weight in gold, sized to reflect this skepticism, as insurance against the scenarios nothing else covers. We continue to prefer productive assets that compound cash flows through full cycles.
Jerome Powell’s tumultuous eight years as Chair of the U.S. Federal Reserve came to an end in May. His tenure saw a global pandemic shut down the world economy for months on end. The response was eye-watering stimulus that held the downturn to a brief recession but subsequently triggered a wave of global inflation. Interest rates rose to levels last seen before the 2008 financial crisis, the “Great Moderation” ended, and the tailwinds that had driven returns in housing, bonds and other rate-sensitive assets turned into headwinds.
Powell’s replacement, Kevin Warsh, arrives at a time when the U.S. government is running massive deficits in recession and expansion alike. Interest payments on the federal debt now exceed military spending10, which has placed interest rates squarely in the President’s sights.
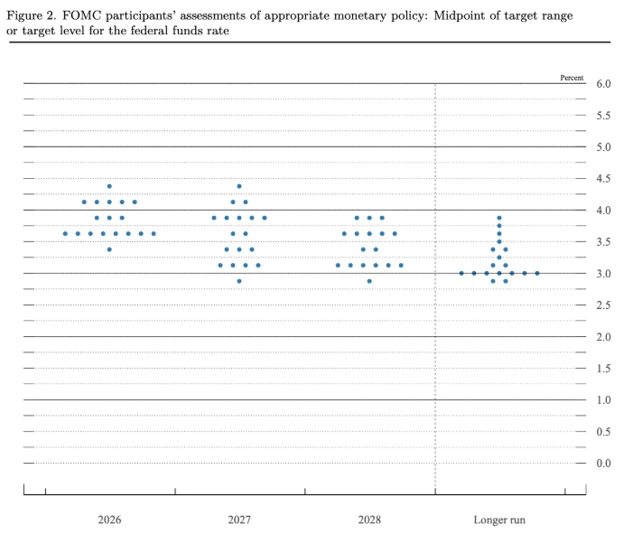
Warsh has promised a “reform-oriented” Federal Reserve11 and offered a preview at his first meeting in June. The committee voted unanimously to hold the policy rate at 3.50% to 3.75%, where it has sat since December.12 The post-meeting statement was dramatically shorter and stripped of the forward guidance that had leaned toward future cuts. Updated projections show the median expectation for rates to end 2026 a quarter point higher than today, and nine of eighteen officials pencilled in at least one hike. That is a sharp reversal from March, when the median still pointed toward cuts. Warsh himself declined to submit a rate projection, consistent with his skepticism of forward guidance. He also announced a series of task forces to review how the Fed measures inflation, communicates with markets and manages its balance sheet. The last item ties back to our discussion of gold, as a shrinking balance sheet would ease the monetary debasement narrative that helped fuel gold’s explosive rally.
Source: Board of Governors of the Federal Reserve System, Summary of Economic Projections, June 17, 2026, Figure 2.
Each dot represents one committee member’s projection for where the policy rate should sit at the end of each year. The 2026 dots drifting above the current 3.50% to 3.75% range illustrate the hawkish shift by the committee, while the cluster near 3% in the longer-run column marks the level the committee considers neutral. The President nominated Warsh in hopes of ushering in lower interest rates, yet Warsh inherits inflation at a three-year high.13 Headline CPI printed 4.2% in May on the back of the energy spike from the war in Iran.14 Energy prices have since subsided following the memorandum of understanding, and the market will be watching the Fed’s next meeting intently, along with updates from the task forces.
Market Performance
Returns - as at June 30th, 2026
S&P TSX Total Return
S&P Total Return
Core Canadian Universe Bond Index (XBB)
MSCI All Country World Index ex U.S. (ACWX)
Gold (in USD)
U.S.$/CND$
3-month
6.3%
14.3%
2.3%
10.9%
(14.4%)
1.6%
YTD
11.1%
10.2%
2.1%
14.6%
(7.1%)
3.3%
Source: FactSet
BCV Balanced Income Fund
7.7%
10.2%
Source: Croesus Software
Pool Performance and Actions Taken in the Second Quarter
Performance for the Balanced Income Fund has been strong, up 10.2% year to date and 17.1% over the past year.15 This has been achieved without taking on additional undue risk, and as outlined below, the portfolio continues to tilt defensively due to valuation concerns.
Equity selection drove results this quarter. United Health and Texas Instruments led contributors, each rising 57% as managed care rebounded after a period of underperformance and chip demand drove Texas Instruments results.16 The Canadian banks continued to add to returns on the strength of eased regulatory conditions on the banking industry17 with Scotia Bank up 29%, CIBC up 24%, National Bank up 25% and Royal Bank up 31%. As discussed above, renewed investor appetite for physical economy businesses drove returns in TFI International, a leading trucking company in North America. On the other side of the ledger, Canadian Natural Resources declined 16% as oil prices declined following easing tensions in the Middle East. Canadian Natural Resources remains up 23% year to date and our thesis on the business is unchanged.
Activity during the quarter reflected the themes above. We initiated positions in Prologis (a global leader in logistics real estate) and McDonald’s, two businesses that operate squarely in the physical economy. Both are high-quality companies trading at what we view as attractive valuations, and both have a history of holding up well in periods of market stress. We also added capital to two existing holdings that fit the same theme, Sunoco (North America’s largest fuel distributor) and Waste Connections. Each reinforces the portfolio’s defensive positioning, and Sunoco carries a generous dividend yield as well.
Our approach through the second half of the year remains unchanged. We will continue to own high-quality, cash-generating businesses and use volatility to add to them at attractive prices. We thank you for your continued trust.
1House of Commons Library, US-Iran Ceasefire and Nuclear Talks in 2026, Research Briefing CBP-10637, July 2026, commonslibrary.parliament.uk/research-briefings/cbp-10637.
2“Oil Prices Back to Pre-War Levels on Rising Middle East Supply,” Al Jazeera, June 25, 2026, aljazeera.com/news/2026/6/25/oil-prices-back-to-pre-war-levels-on-rising-middle-east-supply.
3International Energy Agency, Oil Market Report, June 2026, iea.org/reports/oil-market-report-june-2026; U.S. Energy Information Administration, Short-Term Energy Outlook, June 9, 2026, eia.gov/outlooks/steo.
4Micron Technology, Inc., fiscal third quarter 2026 results, press release, June 24, 2026, investors.micron.com.
5FactSet, price return data as of June 30, 2026.
6FactSet, market capitalization data as of June 30, 2026.
7World Gold Council, Gold Mid-Year Outlook 2026, June 2026, gold.org.
8International Energy Agency, Oil Market Report, May 2026, iea.org/reports/oil-market-report-may-2026.
9FactSet; BCV Asset Management calculations.
10Congressional Budget Office, The Budget and Economic Outlook, February 2026, cbo.gov; Office of Management and Budget, Historical Tables, Table 3.1.
11Kevin Warsh, remarks at swearing-in ceremony, Washington, D.C., May 22, 2026, video via cnbc.com/video/2026/05/22/fed-chair-kevin-warsh-sworn-in-will-lead-reform-oriented-federal-reserve.html.
12Board of Governors of the Federal Reserve System, FOMC statement and Summary of Economic Projections, June 17, 2026, federalreserve.gov.
13“Federal Reserve Holds Interest Rates Steady and Hints at Rate Hike Later This Year,” NPR, June 17, 2026, npr.org/2026/06/17/nx-s1-5860084/fed-chief-warsh-first-fomc-meeting.
14U.S. Bureau of Labor Statistics, Consumer Price Index, May 2026, released June 2026, bls.gov/cpi.
15Croesus, total returns for the period ended June 30, 2026.
16FactSet, as of June 30, 2026; UnitedHealth Group Incorporated, first quarter 2026 results, Form 8-K, April 21, 2026, sec.gov/Archives/edgar/data/731766/000073176626000121/uhgearningsreleaseq12026.htm.
17Office of the Superintendent of Financial Institutions, news release, June 19, 2026, osfi-bsif.gc.ca.